While 2020 was marked by what felt like an endless string of events unprecedented in modern memory, 2021 was the year the pandemic settled in, and everyone attempted to grapple with what that would mean. COVID-19, the rise of social distancing, and masking left some people anxiously adjusting everything in their lives. For others, it meant defiantly adjusting absolutely nothing. For most everyone else in the middle, the pandemic meant trying to find a balance between the two poles, at times teetering back and forth to get to what normal life would look like in a post-pandemic world.
At rd+d, grappling to find the balance meant launching a yearlong-research project in the hopes of helping readers benchmark their experiences and see if their intuitions were in line with that of their peers. Starting in December 2020 rd+d distributed email surveys roughly every two months to qualified subscribers to take the temperature of an industry that was wrestling with major public health concerns, employee health and safety, frustrated consumers, fast-changing local regulations, labor shortages, supply chain crunches, and a tectonic shift to outdoor and off-premises dining.
The mix of questions — some of which were asked repeatedly during the year — sought to provide context for the readers of rd+d as everyone faced yet another unprecedented year in the hospitality industry and the world at large.

Take it Off-Premises
In December 2020, rd+d asked readers where they’d seen the most operator investment in 2020. Outdoor dining and sanitation theater elements dominated at the time, but 12.21% of respondents said they’d seen the most investment in drive-thru additions and upgrades, and another 9.39% said they’d seen the most investment in walk-up windows. For the 11.27% who opted to write in their own answer on that survey, many noted they saw great investment in all of the above but added that investing in carryout and delivery — from integrating new technology to reworking or creating spaces to aid in it — was the biggest area of investment by operators in 2020.
By April 2021 outdoor dining was still leading operator investments, according to 36.36% of rd+d readers, but reinvesting in interiors and on-site dining came in strong with 28.18% of readers. Upgrading and investing in all areas of the off-premises dining experience came in at 19.09%. Drive-thrus and walk-up windows totaled 11.82% of operator investments.
We fielded a version of this question again in August with similar results: Where have you seen the most operator investment in 2021 so far? Outdoor dining topped the list at 46.52%, sanitation theater elements came in at 17.65%, drive-thru upgrades was third at 14.97% and walk-up windows was fourth at 8.56%.
A Year of Challenges
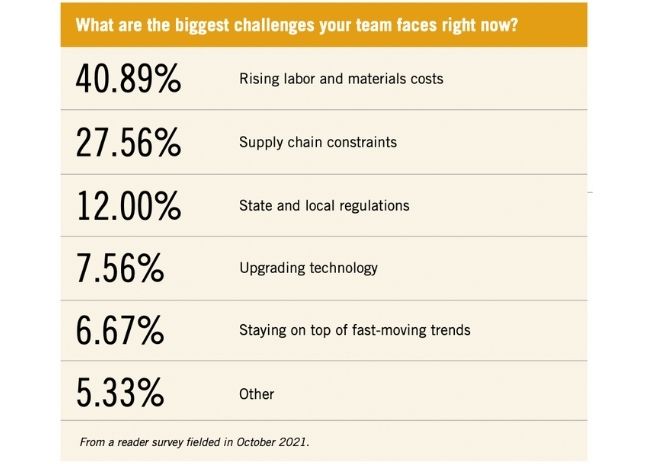
In December 2020, 36.13% of rd+d readers felt state and local regulations were the biggest challenges their teams faced. That number dropped, though, with each survey we fielded in 2021. By April, navigating state and local regulations was the biggest challenge for just 20.93% of respondents. By October, just 12% said that state and local regulations was their biggest challenge.
Staying on top of overall fast-moving trends was another significant challenge for 20.42% of readers in December 2020, placing second in the overall list of challenges. This challenge faded over the course of the year, too. By April it was a top concern for just 13.95% of respondents. By October, staying on top of fast-moving trends was the biggest concern for just 6.67% of readers surveyed, coming in dead last in their list of current challenges.
Managing project budgets was a top challenge for 18.32% of respondents in December 2020. Project budgets continued to be a concern into the spring with 23.26% of respondents in April naming it their top challenge. In October, that challenge had evolved and become more specific with 27.56% of respondents noting supply chain constraints was their greatest challenge.
By October, the biggest challenge facing readers was rising labor and materials costs at 40.89%. Staffing had already started to crop up in the April survey with nearly 20% of readers noting the labor shortage was a growing challenge.
Additionally, 12.04% of those surveyed felt upgrading technology was their biggest challenge at the end of 2020. Improving and upgrading technology peaked as a top challenge in April for 16.28% of readers but that number dropped to just 6.67% by October 2021.
A New New Normal
In the February 2021 survey, 62.5% of restaurant designers surveyed said they were developing designs that took pandemic factors such as social distancing and improved/expanded outdoor dining spaces into account. By August that number remained fairly steady with 59.72% of readers saying they took pandemic factors into account while designing new restaurants. In February, only 16.07% said they were developing designs as if COVID-19 was behind us and no longer a factor but that number had risen to 25% by August.
Some respondents felt the need to clarify and provide nuance. The feedback offered both in February and August offered a mix of responses with one key theme: flexibility. “We’re taking pandemic measures into account but not in a way that will make it necessary to remodel when pandemic regulations are over,” said one. Another noted that they had to be flexible but that there’s a “big emphasis on outdoor spaces and takeout” that wasn’t a focus before.

Can’t Touch This
In December 2020, 26.29% of readers said investments in touchless technologies and “sanitation theater” elements would drive operator investment in 2021. In February, we asked designers which touchless technologies they planned to include in their future designs.
With the rise of sanitation theater and fear of germs and disease heightened among consumers, 28.57% of readers surveyed said they planned to include touchless technologies in restrooms. Touchless ordering and payment came in a close second with 25.71% of survey respondents choosing this option. Touchless doors and entryways came in third place at 21.43% and QR codes for menus was fourth with 20.36% of survey respondents saying they plan to include those in their future restaurant plans.
Construction and Supply Chain Concerns
For those building new units in 2021, construction and materials costs were substantially or somewhat higher, according to 87.8% of respondents surveyed in June. Just 1.22% said costs were about the same, zero said costs are going down. For 10.98% of respondents, the question did not apply because they were not building any new units in 2021.
Permitting was also a challenge for rd+d readers in 2021. 62.20% of readers surveyed in June said that it was taking longer than usual to get permits pulled and plans approved.
Another 23.17% said it was taking about the same amount of time as usual to get permits pulled and plans approved. Just 7.32% said it was taking less time than usual to get permits pulled and plans approved.
The majority of rd+d readers surveyed in June said supply chain shortages were affecting their projects in 2021. Specifically, 48.78% said supply chain issues were affecting project construction timelines for 2021.
Another 40.24% of readers surveyed said that supply chain issues were affecting their entire development pipeline for 2021. Just 4.88% of respondents said supply chain issues have not affected their projects.
One respondent added that “supply chain issues are affecting a portion of our projects, but only in the sense that schedules are being rearranged to accommodate the shortage or lack of an item. A larger concern holding up projects is the lack of help that our vendors, like ourselves, are suffering from.”

Outlook for 2022
In a survey fielded in October 2021, rd+d asked readers to look ahead to identify where they anticipate the greatest development opportunities coming from in 2022. Nontraditional locations that offer a mix of on- and off-premises dining was the answer for 44.59% of readers. However, 31.76% of readers said that traditional units will drive development in 2022. Finally, 19.59% of readers felt that locations with a focus on off-premises dining (such as ghost kitchens and virtual brands) would offer them their greatest development opportunities in 2022.
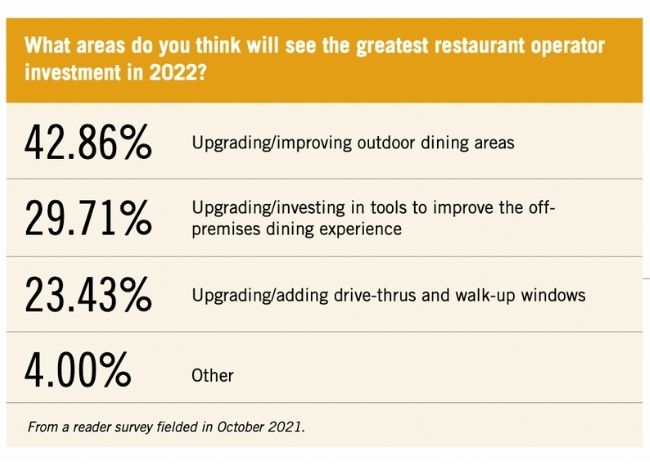
In the same October survey, we asked readers in what areas do they expect to see the greatest operator investment in 2022 and upgrading/improving outdoor dining areas was the clear favorite as 42.86% of respondents chose this option. Trailing a distant second with 29.71% of readers was upgrading and investing in tools to improve the off-premises dining experience. Finally, 23.43% of readers felt that upgrading/adding drive-thrus and walk-up windows would be where operators put their investment dollars in 2022.
In terms of aesthetic trends, 42.48% of readers said biophilic design — bringing the natural world inside — was moving the needle in their pitches and projects as of October 2021. Bright colors and bold statement designs came in second with 30.07% of readers surveyed. Coming in third with 15.03% of readers was luxurious, immersive and glamorous designs. These answers and percentages were statistically unchanged from a survey of rd+d readers fielded in February 2021.
In our final survey question for 2021, we asked readers if business through the third quarter of 2021 was better or worse than projected. In positive news, 43.85% of respondents said that business in 2021 was better than they had projected while 34.62% said business was as good as they had projected. Just 9.23% of readers said business in 2021 was as bad as they had projected and 12.31% said that business in 2021 was worse than they had projected it would be. These numbers were in alignment with earlier surveys. In April 2021, the majority of respondents had projected business to grow (72.60%).
Let’s Stay Outside
In a survey fielded in December of last year, 40.85% of rd+d readers said outdoor dining dominated operator investments in 2020.
When rd+d’s next survey was fielded in February, readers noted the increased investment in outdoor dining would have far-reaching influence: 24.47% said it would mean increased investment in outdoor fixtures and furnishings; 19.15% said it would impact site selection and 16.49% said that it would mean greater investment in structural elements (from wooden outbuildings to plastic igloos) that would let diners enjoy outdoor dining even in inclement weather. Finally, 34.57% said that the rise of outdoor dining would affect all three areas mentioned.
In April, rd+d asked where readers had seen the greatest investment by operators in 2021 so far. Outdoor dining was the number one answer, totaling 36.36% of readers. We asked that question again in August, and the percent of readers who said outdoor dining had dominated operator investment in 2021 jumped to 46.52%.